
Smart Grid – Revisited
Use Case Description
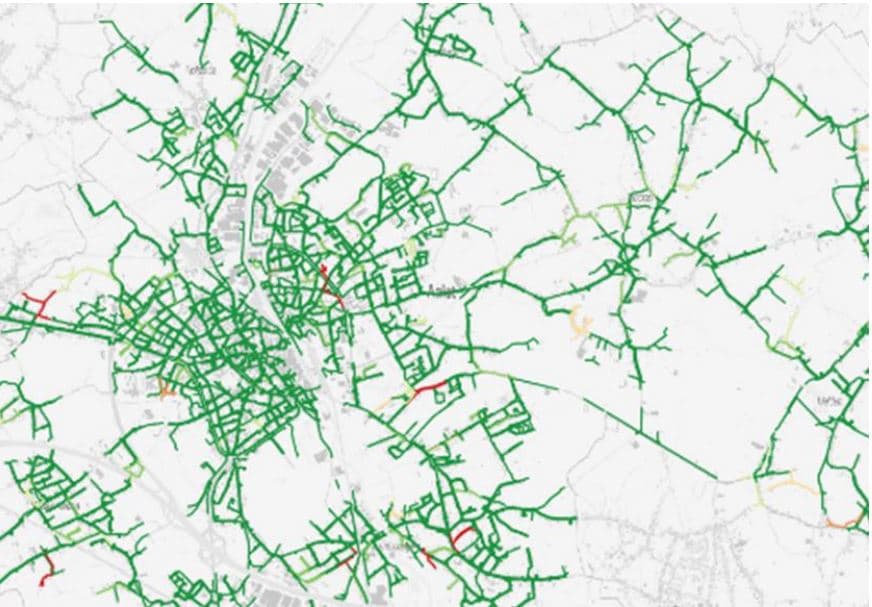
The visibility on the low voltage (LV) distribution grids throughout Europe is limited: the layout of the grids is only partially known, and measurements are limited. In the past, this was acceptable, as we employed a ‘fit and forget’ strategy: install over-dimensioned cables with sufficient capacity to cover all demand peaks. However, the use of distribution grids is rapidly changing. To meet the climate and energy targets, as set in the European Green Deal, the 'fit for 55' package, the Renewable Energy Directive, and the Flemish adoptions via the Vlaams Energie- en Klimaatplan 2021-2030, we need a massive phase out of fossil fuels and a massive increase of renewable energy production.
At the level of Flemish families, this implies a strong shift towards electrical mobility and heatpump heating, and the massive rollout of residential solar panel installations. By 2030, Flanders is expected to count 1 million to 2 million electric vehicles, 25-100% of our houses will be heated with a heatpump, and photovoltaic (PV) production will grow by 450MW per year. This evolution leads to higher loads on the grid, and increased synchronicity, which in turn leads to higher peak loads. The result is that the ‘fit and forget’ strategy becomes increasingly expensive, as many cables and transformers would require reinforcement. For Flanders, the estimated surplus to business as usual investments in the LV grid alone amount to 3B€ in the period up to 2032 (Fluvius investment plan of 2022). The alternative is the development of technology to use the installed capacity more optimally by operating our grids closer to their limit, and to technically support measures to mitigate the impact of the energy transition.
This requires increased visibility on the LV grids: a digital twin of the LV grid that reflects the current state of the grid. This allows optimizations in its configuration, the forecasting of its future state and optimization given that future state. There are commercial tools available for the higher-voltage distribution and transmission grids, but not for the LV grid. The reasons are that the LV grid suffers from the combination of a very large scale non-linear system (Flanders alone counts 3,5 million connection points, 79000 km cable and 40000 MV/LV transformers), highly stochastic (human) behavior at the connection points, and a high number of unknowns. Indeed, the grid layout is only partially, and often incorrectly known throughout Europe. And despite the rollout of smart metering, detailed measurements on connections are sparse due to GDPR privacy and cost reasons.
The purpose of the use case is to research and develop the A.I. techniques required to:
correct, enhance, and enrich the knowledge on the layout of the grid
quantify the uncertainty in, model, and forecast the LV grid offtake and injection timeseries profiles
integrate these novel A.I. techniques into the traditional power systems engineering methods to generate a statistical view on the current and future state of the LV grid.
The Smart Grids use case is also part of the first A.I. research program. Here, the focus was/is mainly on methods that start from a single type of data from the energy field, e.g., digital meter voltage measurements, or digital meter power timeseries, or GIS data describing the layout of the LV grid. In the course of the first A.I. program, an important insight was gained: for many tasks, energy experts beat the state of the art A.I. techniques. They do so by combining different types of data, from within and outside the energy field, and by applying probabilistic reasoning on the insights that are taken from those different sources. E.g., as a simplified example, we can find which house is connected to which cable by investigating voltage measurements of the house and its neighbors on the same side of the street (street maps info), while eliminating possibilities using our knowledge of the grid operational practices. The overarching aim and target for the smart grid use case in the Flemish 2024-2028 A.I. program is to mimic this human expert probabilistic reasoning on multimodal data from within and outside the energy domain. The purpose is to support the grid operators in the field (human in the loop) with decisions and advice to better utilize the current assets installed base, and to optimally invest only where needed.
Results, Highlights & Research Outputs
Improved probabilistic forecasting of electricity consumption time series
A robust and scalable method has been developed to perform probabilistic forecasting of electricity consumption time series. It has been compared with other state-of-the-art methods on a closed dataset from Fluvius and two open datasets [3, 5]. The developed method is better at handling concept drift, i.e., situations where consumption patterns change over time. This could for example be caused by installing an electric vehicle charging stations or by a change in number of people that live in the building. Use-cases are forecasting of the state of the LV grid and energy management systems.
Fast and interpretable scenario generation of electricity consumption time series
A method has been developed to generate scenarios of electricity consumption for consumers for which no smart meter data is available. This is an often a necessary capability for performing grid simulations, since smart meter data is either not installed, the data not transferred to central storage, or is not available because of privacy reasons. The method uses predictive clustering trees. Its performance is similar to state-of-the-art techniques [2], but it is faster and more interpretable.
Explainable representative-days clustering on low-voltage grid meters and feeders
To be able to simulate the state of the grid, we developed a method to cluster all days in a year, where each cluster has one representative day. This allows us to simulate fewer days while retaining almost all of the accuracy. The developed method is interpretable and highly optimized by using noise-aware multi-objective Bayesian optimization [6].
Detecting and correcting errors in the grid structure with prolog
To improve upon the assignment of cables to houses as recorded in the grid data (which can be wrong), several features were developed from GIS data. These were then used to train a prolog program to detect and correct errors in the grid data. In the future, voltage measurements will be included and problog instead of prolog will be used.
Data cleaning with a data quality decision support system
The time series data from the smart meters was used as a POC for a framework for a data quality module in decision support systems [4].
Outputs & Resources
Publications
[1] Botman L, Soenen J, Theodorakos K, Yurtman A, Bekker J, Vanthournout K, Blockeel H, De Moor B, Lago J, A Scalable Ensemble Approach to Forecast the Electricity Consumption of Households, IEEE Transactions on Smart Grid, 2023, 14 1
[2] Soenen J, Yurtman A, Becker T, D’hulst R, Vanthournout K, Meert W, Blockeel H, Scenario Generation of Residential Electricity Consumption Through Sampling Of Historical Data, Sustain. Energy Grids Netw., 2023 34 100985
[3] Botman L, Lago J, Becker T, Agudelo AM, Vanthournout K, De Moor B, A scalable method for probabilistic short-term forecasting of individual households consumption in low voltage grids, IEEE PES grid edge technologies, 2023
[4] Rinaldi G, Crema Garcia F, Agudelo OM, Becker T, Vanthournout K, Mestdagh W, De Moor B, A Framework for a Data Quality Module in Decision Support Systems: an application with Smart Grid Time series, 25th International Conference on Enterprise Information Systems (ICEIS), 2023 443-452
[5] Botman L, Lago J, Becker T, Vanthournout K, De Moor B, A global probabilistic approach for short-term forecasting of individual households electricity consumption, Applied Energy, 2025
[6] Konstantinos T, Agudelo OM, Becker T, Vanthournout K, D’hulst R, De Moor B, Explainable representative-days clustering on low-voltage grid meters and feeders, with noise-aware multi-objective Bayesian optimization, applied to grid-congestion events, Sustain. Energy Grids Netw., 2025
PhD dissertations
Jonas Soenen "Semi-Supervised and Explainable Machine Learning with an Application to the Low-Voltage Grid"
Lola Botman "Time Series Forecasting, Applications on Low Voltage Grid Data"
Konstantinos Theodorakos "Time series analysis and modeling in data science application areas"Outreach
Blog: https://ai.kuleuven.be/stories/post/2021-11-03-energy-forecasting/
Results have been presented to multiple European DSOs.
Uptake
Fair enrichment projects:
PC2Pythia: integration of predictive clustering trees into the Pythia tool of VITO, which forecasts the state of distribution grids
Pythia2GIS: integration of geographical (GIS) information into the Pythia tool of VITO.
Team & Contact
Contact
UC Lead: Koen Vanthournout e-mail
AI Expert Lead: Thijs Becker e-mail
Use Case Lead(s)
Koen Vanthournout, VITO
Principal Investigators / AI Expert Leads
Thijs Becker, VITO; Luc De Raedt, KU Leuven; Hendrik Blockeel, KU Leuven; Bart De Moor, KU Leuven
PhD Researchers
Jonas Soenen; Lola Botman; Konstantinos Theodorakos
Research Groups
VITO-EnergyVille (Koen Vanthournout, Thijs Becker)
DTAI-KUL (Luc De Raedt, Hendrik Blockeel)
ESAT-KUL (Bart De Moor)